


Analytics
Time Series Analysis: Definitions, Types & Challenges
Apr 03, 2024
7 min read
Definition
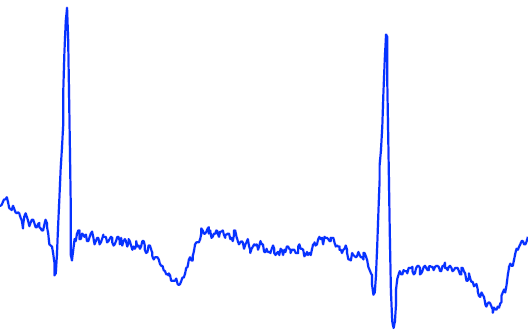
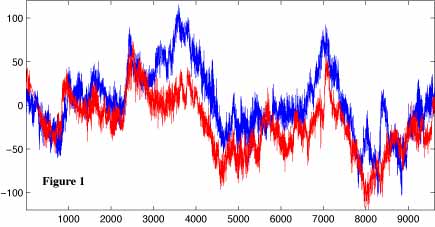
A time series is a collection of observations made sequentially over time. Such series naturally occur in a wide range of domains due to the human desire to measure and monitor phenomena that inherently change with time. Examples include:
- Blood pressure
- Google trends
- Annual rainfall levels
- Stocks
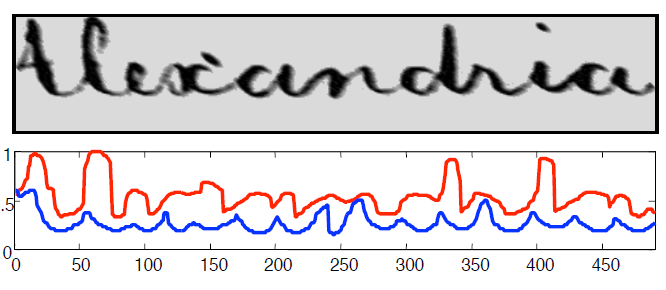
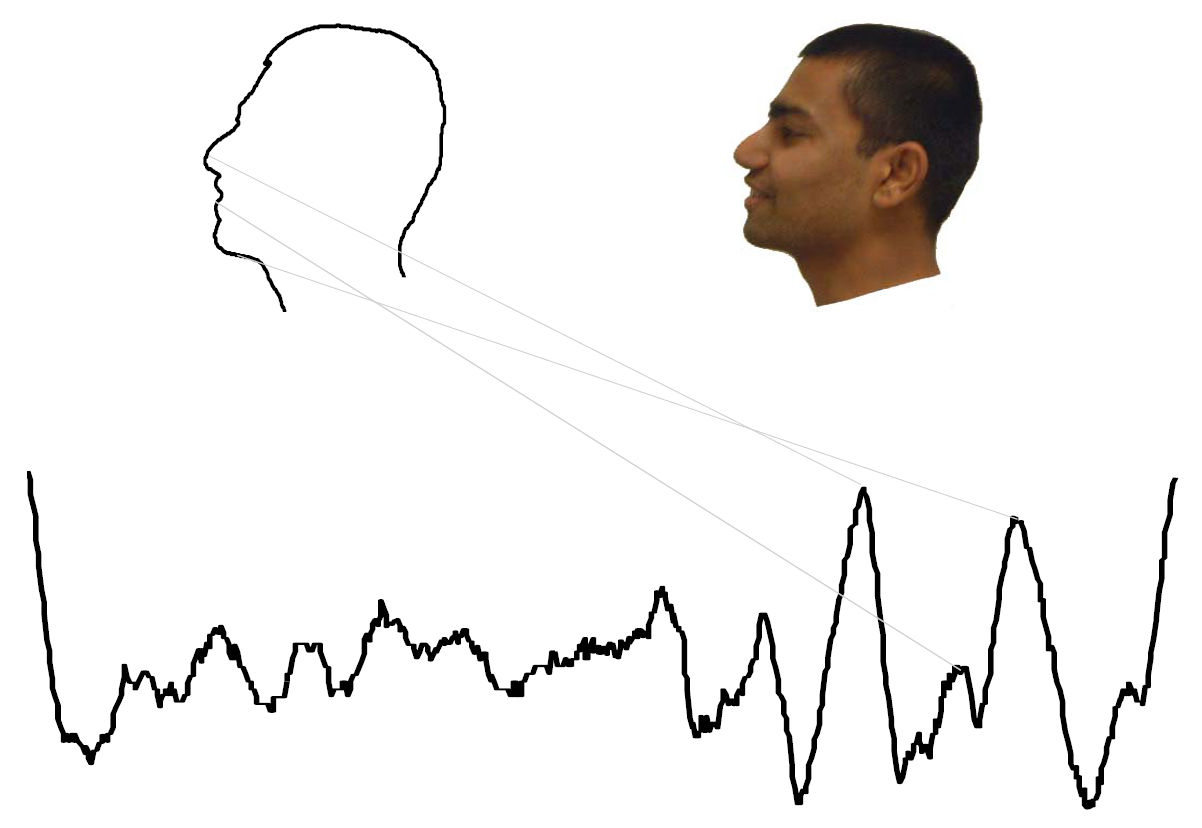
But that's not all! The application of time series analysis extends beyond traditional time-dependent data. We leverage this technique to analyze data that isn't inherently temporal. For instance, we can transform handwriting and images into a time series format, unlocking new possibilities for image data mining.
What do we want to do with time series data?
Time series data offers a rich playground for various analytical tasks that can provide valuable insights across multiple domains.
- One primary application is clustering, where the goal is to group together time series that exhibit similar patterns, aiding in more nuanced segmentation or trend analysis.
- Classification takes this a step further by identifying time series that belong to a specific category, an application that's particularly useful in fields like healthcare for anomaly detection; for example, abnormal heart rate patterns can be flagged in real-time.
- Searching for similar time series within a large database is another vital application, often used in finance to find stocks with correlated performance or in retail to identify similar customer purchase behaviors.
- Forecasting, a cornerstone in domains like supply chain management and sales, relies heavily on time series data to make future predictions.
- Understanding trends and seasonality is also pivotal for planning and optimization across various industries.
- Visualization techniques tailored for time series data can make it easier to interpret complex patterns and make data-driven decisions.
The possibilities are virtually limitless, and the growing need for specialized techniques for manipulating and interpreting time series data is more crucial than ever.
Why is working with time series data so difficult?
Subjectivity: Much of time series analysis hinges on the concept of similarity between different time series. However, defining 'similarity' is not straightforward due to the inherent subjectivity involved. The challenges posed by this subjectivity include
- Context-Dependent: What is considered "similar" in one application or under one set of conditions may not hold true in another.
- Human Bias: Often, the metrics used for similarity are chosen based on human intuition, which can introduce bias.
- Inconsistent Interpretations: Different analysts may have different perspectives on what constitutes similarity, leading to inconsistent interpretations and potentially conflicting conclusions.
- Parameter Sensitivity: Methods to determine similarity often have parameters that need to be set, and different choices can lead to different results.
- Domain-Specific Definitions: In specialized fields, domain-specific metrics may be used to define similarity, which may not be universally applicable or understood.
Sampling rates: Dealing with time series data that have different sampling rates can be a challenging problem. Sampling rate refers to the frequency at which data points are collected or recorded. For example, one time series may have data points collected every minute, while another may have data points collected every hour
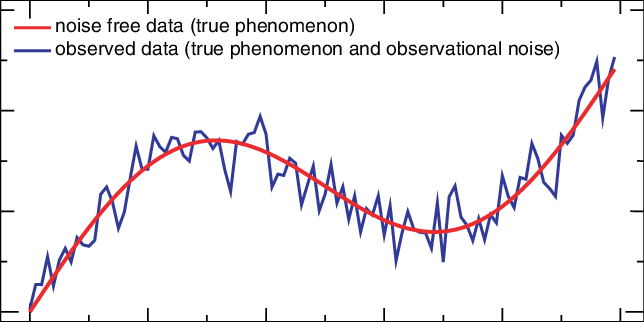
Noise and missing values: These are common issues in time series data that can significantly impact the quality of analysis and predictions. The challenges include:
- Distorted Signal: Noise can distort the underlying trend and seasonality, making it difficult to identify true patterns.
- Imprecise Forecasting: Noise can lead to inaccurate or imprecise forecasting models, as the model may attempt to fit the noise rather than the signal.
- False Anomalies: High noise levels can make it difficult to distinguish between actual anomalies and random fluctuations.
Time series similarity
Now that we can identify the challenges, it’s time to look over some cool techniques used to find time series similarity.
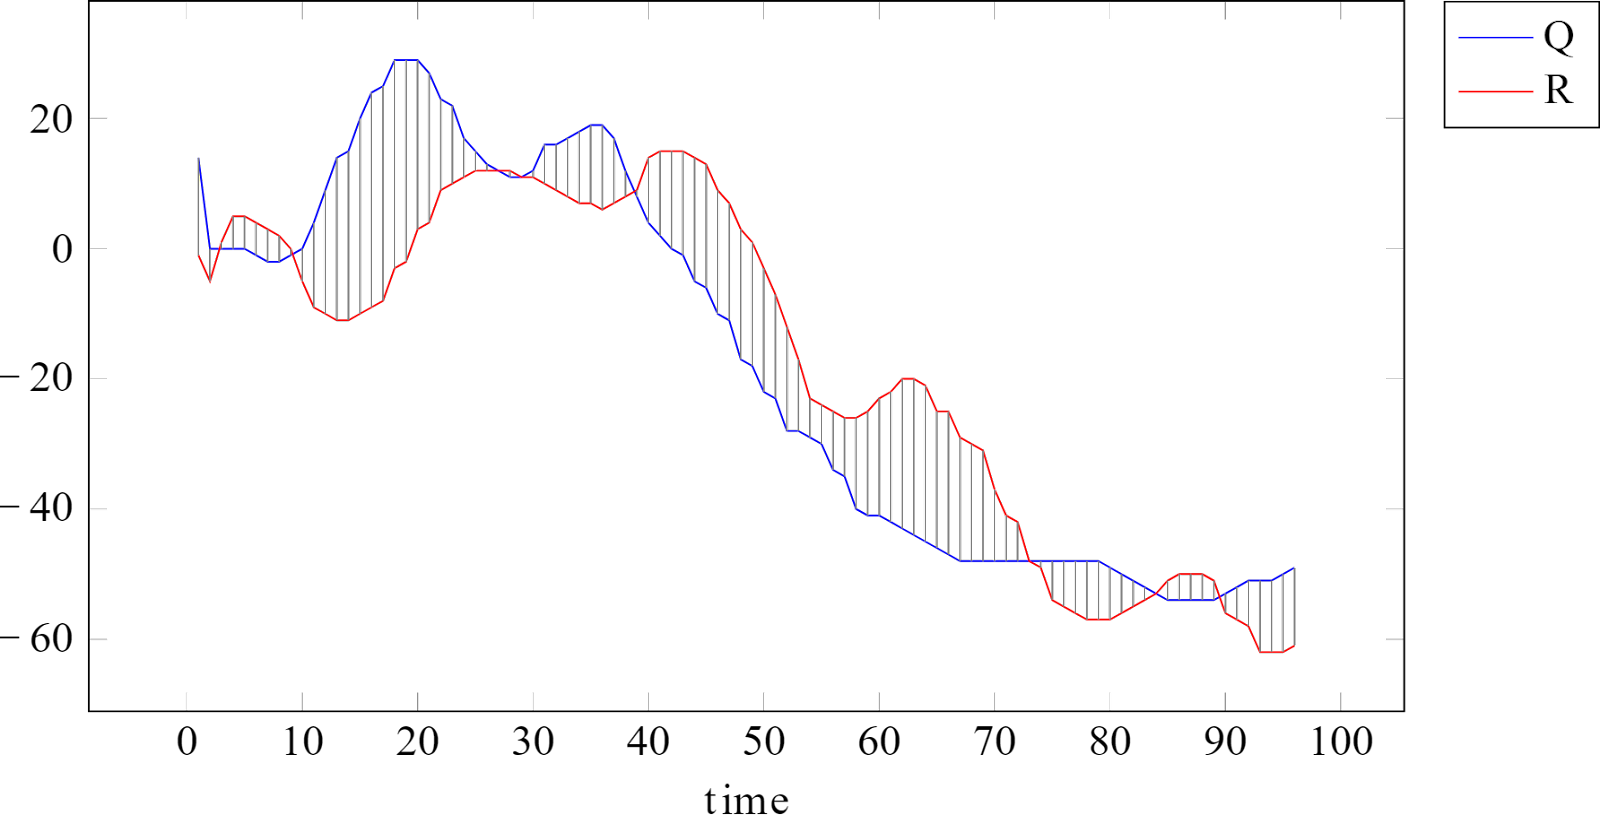
Euclidean distance
The Euclidean distance is one of the most straightforward and commonly used methods for calculating the similarity between two time series. However, it can be computationally expensive, especially for long sequences or large datasets. This is primarily because the calculation involves taking the square root of the sum of squared differences between corresponding points in the two time series.
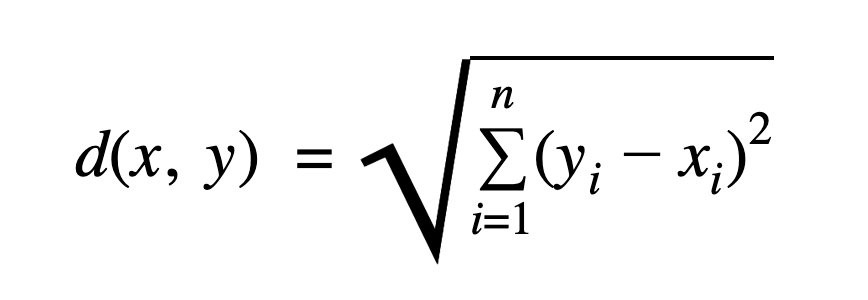
Squared Euclidean distance
The Squared Euclidean distance is simply the Euclidean distance without taking the square root:

Euclidean distance and Squared Euclidean distance are equivalent in the sense that they return the same rankings, clusterings and classifications. Squared Euclidean distance is computationally cheaper because it avoids the square root operation.
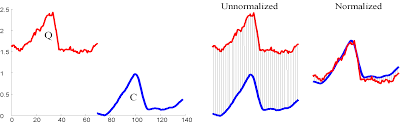
Dynamic Time Warping (DTW)
Dynamic Time Warping (DTW) is a technique used for measuring similarity between two time series which may vary in time or speed. Unlike the Euclidean distance, which assumes a one-to-one mapping between points in the two series being compared, DTW allows for "warping" of the time dimension. This means that the algorithm can find an optimal match between two time series even if they are out of phase.
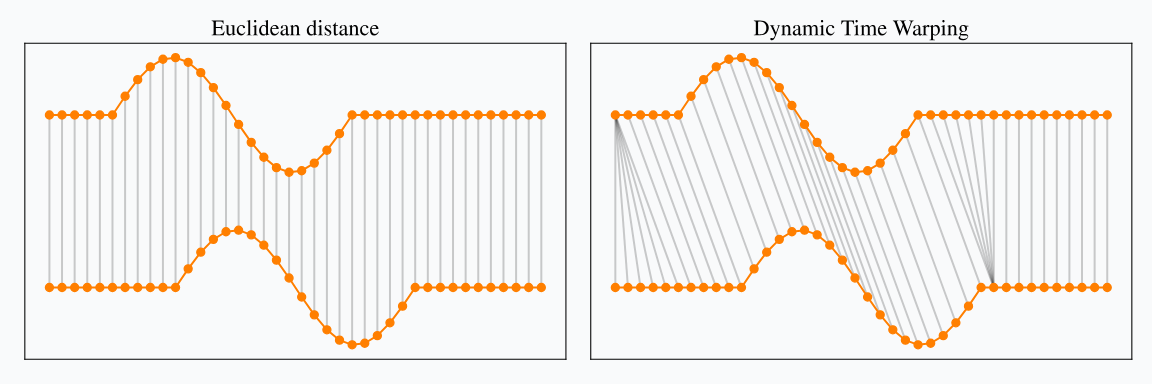
Comparison
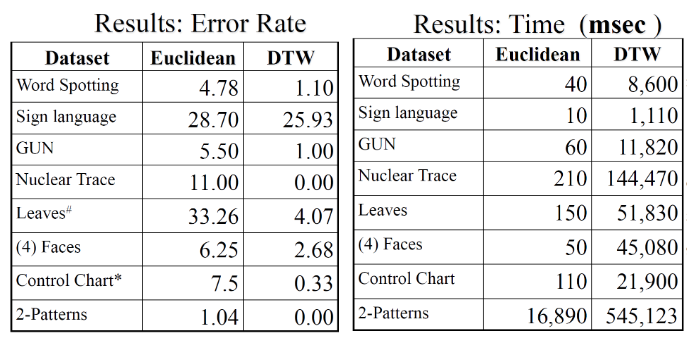
DTW generally yields superior results across a variety of datasets but with a greater computational cost. DTW is two to three orders of magnitude slower than Euclidean distance.
Preprocessing Techniques
Preprocessing techniques like offset translation, amplitude scaling, linear trend removal, and noise reduction can significantly improve the performance and accuracy of distance-based similarity algorithms like Euclidean distance or Dynamic Time Warping (DTW). Here's why each of these preprocessing steps is important:
- Offset Translation
Time series data often come with a baseline offset that can distort the distance metrics. An offset can add a constant bias in distance calculations, making genuinely similar patterns appear dissimilar. Removing the offset ensures that the focus is on the shape of the series, not on their absolute values.
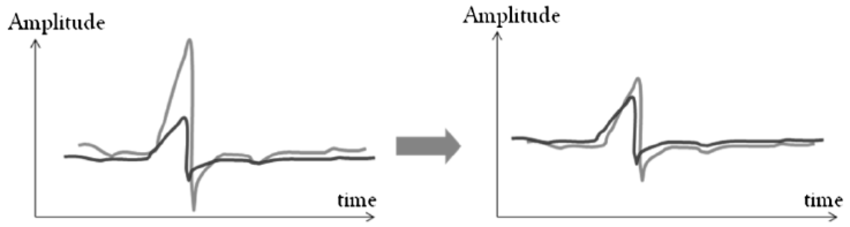
- Amplitude Scaling
Different time series may operate on different scales, affecting the distance metrics. High-amplitude series can dominate distance calculations when compared with low-amplitude series. Scaling the amplitude makes it possible to compare the inherent patterns in the time series independent of their magnitudes.
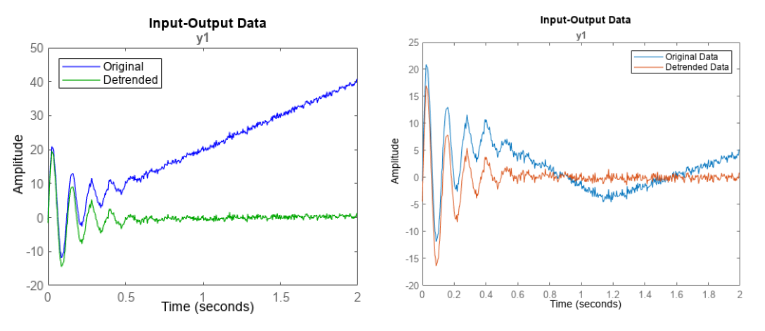
- Linear Trend Removal
Some time series have underlying trends that can overshadow shorter-term features or patterns. The presence of a trend can make two similar time series appear dissimilar if one has a trend and the other does not. Detrending the data ensures that the similarity measure focuses on the intrinsic patterns in the data rather than the overall trend.
- Noise Reduction
Real-world time series data often contain noise that can make similarity detection difficult. Noise can introduce spurious dissimilarities, making it harder to match series effectively. Smoothing out noise focuses the similarity measure on the essential features of the data, improving both accuracy and robustness.
What about Digital Analytics?
Why don't we use all these techniques for digital analytics anomaly detection?
You might wonder, with the array of advanced techniques available for time series analysis, why aren't they commonly applied for daily anomaly detection in digital analytics data? The answer lies in the unique challenges posed by this specific type of data.
Granularity
Conducting daily similarity checks for anomaly detection in the realm of digital analytics data presents a multitude of challenges that make the process computationally expensive and resource-intensive. One of the foremost issues is the granular nature of the data.
Digital analytics platforms often collect data at an extremely fine level of detail, sometimes down to the millisecond. This granularity means that even a single day's worth of data can contain millions of data points, requiring substantial computational power to aggregate and analyze.
Seasonality
Moreover, digital analytics data often exhibit strong temporal patterns and seasonality. For example, web traffic may spike during certain hours of the day or on specific days of the week, requiring algorithms that can adapt to these cyclical changes. Simple distance metrics may not suffice, and more complex models that account for these temporal fluctuations are needed. This again increases the computational burden.
Dimensionality
Then there's the issue of high dimensionality. Digital analytics data typically consist of multiple metrics and dimensions—ranging from page views and click-through rates to more advanced metrics like user engagement scores. Computing similarities in such high-dimensional spaces is not only computationally expensive but also risks diluting the meaningful signals in a sea of noise, a phenomenon known as the "curse of dimensionality."
Resources
Finally, the sheer computational resources required to process, clean, and analyze this data can be significant, especially if you aim to do this on a daily basis. Even with optimized algorithms and high-performance computing environments, the task can be time-consuming and expensive, requiring specialized hardware and software resources.
Summary
It's worth noting that the field is vast and continuously evolving, with other advanced methods like Long Short-Term Memory (LSTM) networks for deep learning, Fourier Transform for frequency domain analysis, and various ensemble methods combining multiple similarity metrics. Due to the breadth and depth of the subject, it's challenging to dive into every technique in a single post, but the current state of the field offers a rich set of tools for various applications, from finance and healthcare to engineering and beyond.
While traditional methods of time series analysis may pose challenges for daily anomaly detection in digital analytics, solutions like the Baresquare platform are designed to address these complexities. Our platform performs 24/7 anomaly detection, tracks site or campaign performance, and surfaces issues before they become problems, providing you with a robust and hassle-free way to keep your digital analytics on track.


Start your 30-day free trial
Never miss a metric that matters.


No credit card required
Cancel anytime
© 2023 Baresquare | All rights reserved.


